


")


Dear Partners,
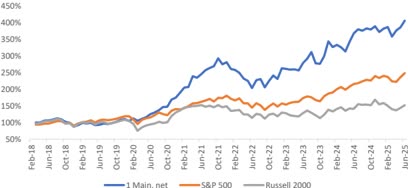
For the second quarter, 1 Main Capital Partners, L.P. (‘ 1MC ‘) return ed 13.3%, compared to 10.9% and 8.5% for the S&P 500 (SP500), (SPX) and Russell 2000 (RTY), respectively.1
| Inception | Inception | ||
|---|---|---|---|
| 2025 YTD Cumulative Annualized | |||
| 1 Main Capital Partners – net | 9.2% | 306.4% | 20.8% |
| S&P 500 | 6.2% | 148.6% | 13.1% |
| Russell 2000 | -1.8% | 52.0% | 5.8% |
|
ITD is from the Fund’s inception, February 1, 2018. |
Stocks saw a resurgence in the back half of the quarter as the market’s perception of Liberation Day shifted from end-of-the-world to nonevent. As has been the case since the beginning of 2023, the largest technology companies and most meme-worthy stocks are commanding outsized attention and valuation multiples, while small boring businesses are ignored. At quarter end, profitable companies in the RTY sold for 16x forward earnings, compared to 22x for the SPX and 27x for the Magnificent 7. 1MC ‘s strategy of buying good businesses with aligned management at attractive prices typically causes us to miss euphoric upswings but leaves us well-positioned to capitalize on volatility created by reversals. I look forward to the opportunities created by the next downswing when it occurs.
1MC ‘s largest contributors in Q2 were International Workplace Group (IWGFF, IWG LN) and Basic-Fit (BSFFF, BFIT NA), appreciating 23% and 37%, respectively. We continue to own both in size, and I am optimistic that they will continue to perform well.
We also experienced a permanent capital loss of 2%, for both the quarter and year from an opportunistic investment, Superior Industries International (OTC:SSUP), that we exited after it announced the simultaneous loss of its two largest customers. Our rapid exit of the position saved us an additional 1%, which would have been wiped when the company ‘s lenders took control in an out-of-court restructuring. This loss is frustrating, because I expected significant near-term appreciation after management indicated that the new business pipeline was strong and that it was in advanced discussions to take out its preferred equity at a significant discount, addressing nearing maturities. I always demand significantly higher returns from opportunistic investments exactly for this reason -our wins need to be much bigger to make up for the potential losses.
The Fund continues to be highly concentrated in our top three holdings, which account for 55% of capital and have all the characteristics I seek in core investments, very much resembling some of our past winners. My confidence in these positions at current prices gives me optimism that our future is bright.
Types of Alpha
To outperform the market, fund managers must generate alpha over time, which can largely be served in two ways: i) levering it up or ii) layering it on top of beta. Each approach has its own risks and benefits.
Levered alpha is a spread game that requires isolating it and managing volatility. This is because margin loans can be called in at any time, and temporary losses are made permanent if one is forced to unwind positions at the wrong time. However, levered alpha is attractive because it can deliver consistent returns regardless of which direction the market moves over the short run.
Layered alpha is an absolute return game that requires good security-selection and the embracing of volatility. If equity beta typically delivers investors 10% annualized over long stretches, picking and concentrating in the better stocks leads to outperformance. Of course, while unleveraged layered alpha is not exposed to margin calls, it does leave investors exposed to market drawdowns every so often.
I prefer layered alpha over levered alpha because I trust my ability to pick good securities more than I trust my prime broker to not deliver a margin call at an inconvenient time. Without leverage, I expect that a disappointing outcome would be to slightly underperform the market over time, rather than permanently impairing our capital.
Current Positioning
At quarter-end, 1MC ‘s top five positions were Basic-Fit (BFIT NA), dentalcorp (OTCPK:DNTCF, DNTL CN), International Workplace Group (IWG LN), MasterCraft Boat (MCFT) and Water Intelligence (OTCPK:WTLLF, WATR LN), which together accounted for 70% of capital.
MasterCraft Boat
Three years after our exit, 1MC has re-initiated an investment in MCFT, a business we know well and have owned profitably several times in the past. I’ve long believed this to be a good business, but the last several years were challenging while the industry worked through a painful period of dealer inventory destocking. I believe this has finally run its course.
MCFT has a loyal customer base and strong brand, while the current valuation is not reflective of its true normalized earnings power. The re-establishment of a position here is a classic example of our strategy in action: buying a great business at an attractive price when the market has given up on the name.
The company is a leading manufacturer of water ski and wakeboard boats, an end market that benefits from volume growth driven by the secular trend toward more active, experience-based lifestyles. Importantly, waterski and wakeboard boat buyers are extremely brand-loyal, with the top three manufacturers controlling 2/3 of the market. This allows MCFT to compete primarily on features rather than price.
Over the last few years, I have watched from afar as retail demand for boats declined substantially while dealers ordered even fewer new boats than they were selling to reduce inflated inventory. To put some numbers around it, MCFT should sell around 2k boats in FY’25, compared to anticipated retail demand of around 3k. This level of production is approximately 50% below the five-year average leading up to the pandemic, and 60% below FY ‘ 22. Impressively, the company will likely still be profitable and generate free cash flow.
While it’s tough to time the exact bottom in terms of retail demand, I believe we are at or near the end of dealer destocking. Because of this, MCFT should benefit from volume and earnings growth next year even if the retail environment remains challenged. There is a very long way to go before we get back to midcycle earnings of $3.50 per share or more today, before any reduction in share count.
Investor fatigue with MCFT’s depressed earnings and lack of near-term visibility is punishing the stock price. However, I am happy to look forward rather than back. This is a business that, despite its cyclical nature, has consistently demonstrated attractive returns on capital. Additionally, its net cash balance sheet provides a margin of safety while allowing MCFT to reduce the share count over the next few years, driving mid-cycle EPS even higher. I am confident that as the earnings power normalizes and the market recognizes the strength of the business and its valuable brands, we will be well-rewarded for being a bit early and looking forward.
Outlook
As we move into the second half, the outlook remains murky. Despite all the recession talk, data shows an economy that remains resilient. Consumer spending continues to increase while the labor market is showing signs of normalization from overheated levels, allowing wage growth to continue decelerating.
At the same time, trade and tariff tensions have caused consumer sentiment to remain cautious. The worry of inflation resurfacing pushed the Fed to pause rate cuts as it tries to balance inflation risk with the desire to support growth. Fed chairman Jay Powell’s comments at Jackson Hole suggest this pause could soon be over.
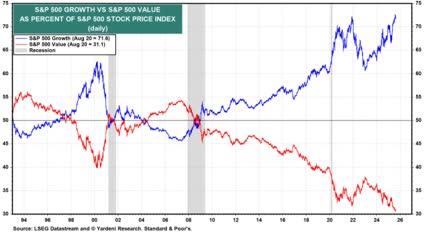
The confusion over continued economic growth and resurgent inflation has resulted in continued market bifurcation. Large cap growth and speculative assets have demonstrated significant strength, while the Russell 2000 and other value-oriented, small-cap names have lagged. This is the very dynamic that creates the opportunities we seek. When the market is fixated on a narrow set of themes and willing to pay an ever-higher price for them, it inevitably creates bargains elsewhere.
This environment is ideal for disciplined, long-term investors. It’s our job to ignore the noise and identify high-quality businesses that the market has abandoned. The re-initiation of our MCFT position is a perfect example of this philosophy. We are buying a business with a pristine balance sheet and a strong franchise at a valuation that assumes its earnings are permanently impaired, just as its business cycle is bottoming. I believe this patience and a focus on fundamentals will serve us well and remain confident that our portfolio of high-quality, undervalued businesses will continue to compound capital over the long run, regardless of short-term market volatility.
Other Updates
I was recently featured in the July edition of Value Investor Insight, where I described the firm’s investment strategy in more detail. I also discussed a few of 1MC ‘s larger investments. If you haven’t had a chance to read it yet, I encourage you to do so.
The Founder’s Class also remains open with approximately $25 million of capacity remaining. Please reach out with any thoughts or questions. Thank you for your support and confidence.
Sincerely,
Yaron Naymark
Performance Summary 2
| 2025 | Jan | Feb | Mar | Apr | May | Jun | Jul | Aug | Sep | Oct | Nov | Dec | YTD |
|---|---|---|---|---|---|---|---|---|---|---|---|---|---|
| 1 Main Capital Partners – Gross | 3.5% | 1.7% | -8.1% | 5.2% | 3.1% | 6.5% | 11.7% | ||||||
| 1 Main Capital Partners – Net | 2.8% | 1.4% | -7.5% | 5.1% | 2.5% | 5.2% | 9.2% | ||||||
| S&P 500 index – incl dividends | 2.8% | -1.3% | -5.6% | -0.7% | 6.3% | 5.1% | 6.2% | ||||||
| Russell 2000 – incl dividends | 2.6% | -5.4% | -6.8% | -2.3% | 5.3% | 5.4% | -1.8% |
| One Year | Three Year | Five Year | Since Inception | Inception Annualized | |
|---|---|---|---|---|---|
| 1 Main Capital Partners – Gross | 13.3% | 30.1% | 33.6% | 473.3% | 26.5% |
| 1 Main Capital Partners – Net | 10.4% | 25.9% | 26.6% | 306.4% | 20.8% |
| S&P 500 index – incl dividends | 15.1% | 19.7% | 16.6% | 148.6% | 13.1% |
| Russell 2000 – incl dividends | 7.7% | 10.0% | 10.0% | 52.0% | 5.8% |
|
IMPORTANT DISCLOSURES In general . This disclaimer applies to this document and the verbal or written comments of any person presenting it (collectively, the ‘ Report ‘). The information contained in this Report is provided for informational purposes only and does not contain certain material information about 1 Main Capital Partners, L.P. (‘ 1MC ‘), including important disclosures and risk factors associated with an investment in 1MC, and no representation or warranty is made concerning the completeness or accuracy of this information. To the extent that you rely on the Report in connection with an investment decision, you do so at your own risk. Certain information contained herein was obtained from or provided by third-party sources; although such information is believed to be accurate, it has not been independently verified. The information in the Report is provided to you as of the dates indicated and 1 Main Capital Management, LLC and its affiliates (collectively, the ‘ Manager ‘) do not intend to update the information after its distribution, even in the event the information becomes materially inaccurate. No offer to purchase or sell securities . This Report does not constitute an offer to sell, or the solicitation of an offer to buy, and may not be relied upon in connection with the purchase of any security, including an interest in 1MC or any other fund managed by the Manager. Any such offer would only be made by means of 1MC ‘s formal private placement documents, the terms of which shall govern in all respects. Performance Information . Unless otherwise noted, any performance numbers used in the Report are for the 1MC ‘s Class A Interests, and are net of any accrued incentive allocation, management fees and other applicable expenses, include the reinvestment of dividends, interest and capital gains, and assume an investment from inception of such Class. As such, the pe rformance numbers do not reflect the performance of any particular investor’s interest and you should not rely on it as a statement of your actual return. Past performance . In all cases where historical performance is presented, please note that past performance is not a reliable indicator of future results and should not be relied upon as the basis for making an investment decision. Risk of loss . An investment in 1MC will be highly speculative, and there can be no assurance that 1MC ‘s investment objective will be achieved. Investors must be prepared to bear the risk of a total loss of their invested capital. Portfolio Guidelines/Construction . Information contained in this Report, especially as it pertains to portfolio characteristics, construction, profiles or investment strategies or objectives, reflects the Manager’s current thinking based on normal market conditions, and may be modified in response to the Manager’s perception of changing market conditions, opportunities or otherwise, in the Manager’s sole discretion, without further notice to you. Any target strategies, objectives or parameters are not projections or predictions and are presented solely for your information. No assurance is given that the 1MC will achieve its investment strategies, objectives or parameters. Index Performance . The index comparisons are provided for informational purposes only. The S&P 500 Total Return Index (SPXT) is a capitalization weighted index that is designed to measure the performance of the broad U.S. economy through changes in the aggregate market value of 500 stocks representing all major industries. There are significant differences between 1MC and the index referenced, including, but not limited to, risk profile, liquidity, volatility and asset composition. The index reflects the reinvestment of dividends and other income, are unmanaged, and do not reflect a deduction for advisory fees. An investor may not invest directly into an index. For the foregoing and other reasons, the performance of the index may not be comparable to 1MC ‘s and should not be relied upon in making an investment decision with respect to the 1MC. No tax, legal, accounting or investment advice . The Report is not intended to provide, and should not be relied upon for, tax, legal, accounting or investment advice. Logos, trade names, trademarks and copyrights . Certain logos, trade names, trademarks and/or copyrights (collectively, ‘ Marks ‘) contained herein are included for identification and informational purposes only. Such Marks may be owned by companies or persons that are not affiliated with the Manager or any the Manager managed fund and no claim is made that any such company or person has sponsored or endorsed the use of such Marks in the Report. Confidentiality/Distribution of the Report . The information in this Report is confidential. By accepting any portion of the Report, you agree that you will treat the Report confidentially. It is intended only for the use of the person to whom it is given and the Manager expressly prohibits its redistribution without the Manager’s prior written consent. The Report is not intended for distribution to, or use by, any person or entity in any jurisdiction or country where such distribution or use is contrary to law, regulation or rule. |
Original Post
Editor’s Note: The summary bullets for this article were chosen by Seeking Alpha editors.
Read the full article here
")
")